Apply

Engineering, Architecture and Technology

Open Main MenuClose Main Menu

firefighter

The results


Slide titled "Monitoring the mental health of first responders has become an increasingly important issue." It presents statistics on suicidal thoughts among U.S. firefighters and specific departments. Key data includes: - Suicidal ideation among U.S. firefighters increased from 11% in 2023 to 19% in 2024–2025. - Department-specific rates range from 5% to 17%. - Specialty stations report higher suicidal thoughts (23.5%) compared to non-specialty stations (13.1%), a difference of +11%.

Slide titled "PTSD and Burnout" with data from 864 U.S. firefighters (2024–2025). It includes two graphs and key statistics: - Turnover Intentions:   - 21% intend to quit the fire service   - 17% intend to leave the industry - Left Graph – Self-Reported Burnout and PTSD:   - PTSD increased from ~1.9 (2023) to ~2.3 (2024–2025)   - Burnout increased from ~2.9 to ~3.1   - Departmental PTSD ranges from ~1.9 to ~2.7; burnout from ~2.7 to ~3.1   - 42% report burnout; 17% report PTSD - Right Graph – PTSD and Burnout by Station Type (2024–2025):   - Burnout: 40.3% (non-specialty) vs. 44.4% (specialty)   - PTSD: 13.6% (non-specialty) vs. 19.1% (specialty)

Slide titled "Mental Health Outcomes by Org Type & Service Area (US Firefighters 2024–2025)" with data from 864 respondents. It includes two line graphs: - Left Graph – By Organization Type:   - Career firefighters report the highest rates:     - Suicidal thoughts: 22%     - PTSD: 20%     - Burnout: ~48%   - Volunteer firefighters report the lowest:     - Suicidal thoughts: 16%     - PTSD: 16%     - Burnout: ~31%   - Combination departments fall in between. - Right Graph – By Service Area:   - Urban areas show the highest rates:

Slide displays a conceptual model diagram illustrating factors influencing firefighter mental health and job outcomes. Central element is Station Culture (noted as "Masculine Culture"), which connects to: - General Stressors and Disaster Stressors (both operational/managerial) - Demographics (e.g., rank, tenure, gender) - Coping Strategies (positive or negative) These elements influence Emotional States (anxiety, exhaustion), which in turn affect: - Mental Health Outcomes (PTSD, suicidal ideation) - Job Outcomes (withdrawal, performance, turnover) Coping Strategies also directly influence both mental health and job outcomes.

Slide titled "Firefighter Stressors: Most Impactful" featuring a bar chart and a ranked list of individual stressor items. - Bar Chart:   Displays average impact ratings (scale 1.00–5.00) for common firefighter stressors. Top stressors include:   - Disruption of sleep at work (3.14)   - Disruption of sleep at home (2.72)   - Job skill concerns (2.53)   - Staffing issues (2.42)   - Conflicts with coworkers (2.30)

Slide titled "Often Coping with Stress Using Negative Mechanisms." It includes two visual sections: - Left – Bar Chart:   Shows the percentage of firefighters using various negative coping strategies:   - Self-blame: 49.3%   - Excessive venting: 38.6%   - Social withdrawal at the station: 25.9%   - Alcohol and substance misuse: 19.5%   - Detachment: 15.0% - Right – Line Graph:   Compares negative coping between Non-Specialty and Specialty Stations:   - Self-blame: ~50% (non-specialty), ~45% (specialty)   - Excessive venting: ~35% vs. ~30%   - Social withdrawal: ~21% vs. ~22%   - Alcohol/substance misuse: ~13% vs. ~14%   - Detachment: ~11% (non-specialty only)

Slide titled "Fire Service Culture: Negative Attitudes Towards Emotional Expression." It includes two bar charts and a descriptive text. - Left Bar Chart – Stigma-Driven Coping Barriers:   Shows reasons firefighters avoid emotional expression:   - Lack of psychological safety: 40.2%   - Emotional expression norms (viewed as weakness): 36.7%   - Masculine culture: 34.1% - Right Bar Chart – Emotional Expression Culture by Station Type:   Compares Non-Specialty vs. Specialty Stations:   - Emotional expression norms: 32% (non-specialty), 38.7% (specialty)   - Masculine culture: 27% (non-specialty), 36.9% (specialty) - Text Description:   Notes that in hyper-masculine fire service cultures, expressing emotions is seen as weakness or incompetence, reducing help-seeking behavior and increasing difficulty managing stress.

Slide titled "The Difference (Interaction Effects) A" featuring a graph that illustrates how emotional expression norms interact with critical incident stressors to influence negative coping behaviors. - X-axis: Operational Stressors (Critical Incidents), ranging from -1 to 1 - Y-axis: Negative Coping (Use of Substance & Alcohol), ranging from 1.8 to 2.6 Two lines represent emotional expression norms: - Red line (Negative Emotional Expression Norms): Steep upward slope, indicating

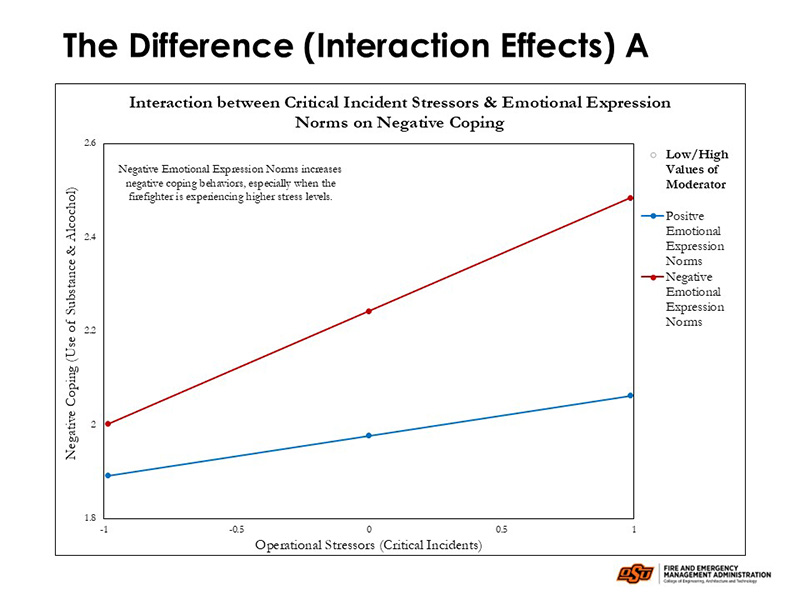
The main takeaway from the graph is that negative emotional expression norms increase negative coping behaviors (alcohol and drug use), especially when the firefighter is experiencing higher levels of critical incident stress.

Slide titled "Interaction between Critical Incident Stressors & Negative Coping on Suicidal Ideation." It features a line graph with: - X-axis: Operational Stressors (Critical Incidents), ranging from -1 to 1 - Y-axis: Suicide Ideation, ranging from 1.1 to 1.7 Two lines represent coping levels: - Blue line (Low Drug/Alcohol Use): Flat across stress levels - Red line (High Drug/Alcohol Use): Increases with higher stress A note on the graph reads: Coping via Alcohol & Drug Use increases suicidal ideation, especially when the firefighter is experiencing higher stress levels.

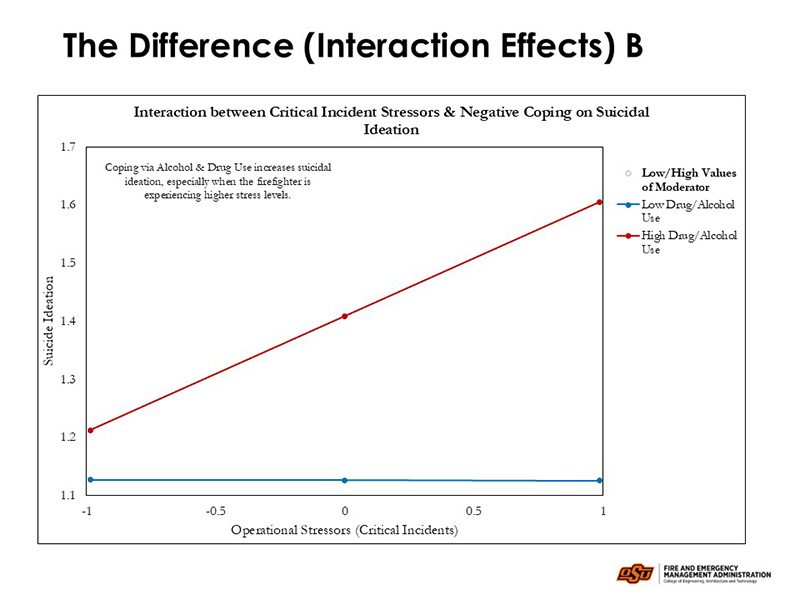
The main takeaway from the graph is that alcohol and drug use as a coping mechanism increases suicidal ideation, especially when the firefighter is experiencing higher critical incident stress levels.

Slide titled "Interaction between Stress and Negative Coping on Suicide." It features a line graph with: - Y-axis: Suicide Ideation (scale 1 to 5) - X-axis: Two categories — Low Sleep Stress and High Sleep Stress Two lines represent coping levels: - Blue line (Low Coping with Drugs and Alcohol): Rises slightly from ~1.5 to just above 2 - Red line (High Coping with Drugs and Alcohol): Rises more steeply from ~2 to nearly 3 The graph illustrates that suicidal ideation increases more sharply under high sleep stress when negative coping (e.g., substance use) is also high.

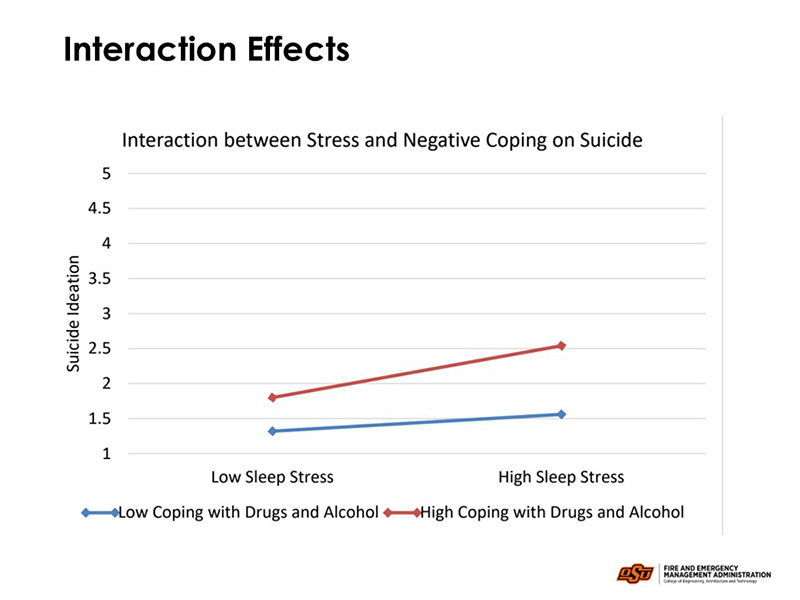
The main takeaway from the graph is that using drugs and alcohol as a coping strategy increases suicide ideation, especially when the firefighter is experiencing higher levels of stress.

This means that as stress increases, those who utilize drugs and alcohol as a coping strategy reporting higher levels of suicide ideation.

Slide titled "The Difference (Interaction Effects)" with a graph labeled "Interaction between Stress and Negative Coping on PTSD." - X-axis: Stress levels (from Low to High) - Y-axis: PTSD levels (scale 1 to 5) Two lines represent coping styles: - Blue line (Low Negative Coping Styles): Flat, showing little change in PTSD across stress levels - Red line (High Negative Coping Styles): Slopes upward, indicating PTSD increases with higher stress when negative coping is high The graph illustrates that negative coping intensifies the impact of stress on PTSD.

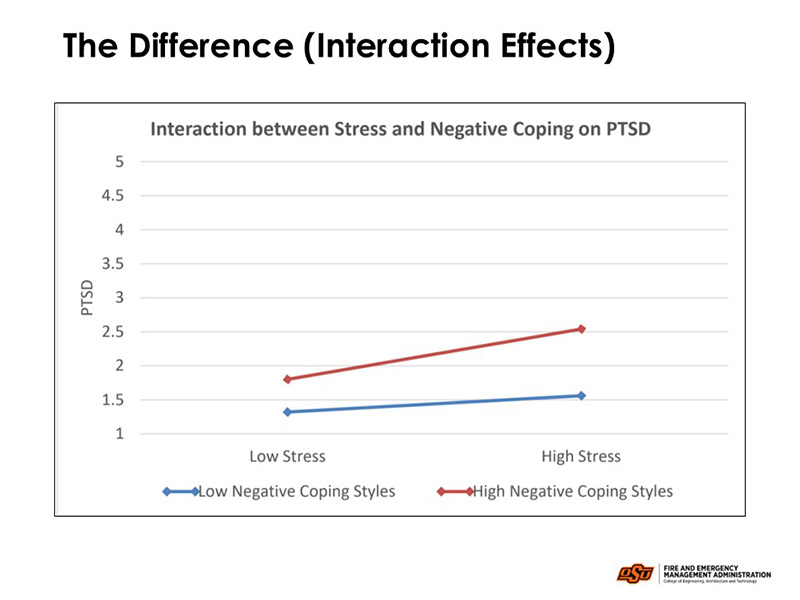
The main takeaway from the graph is that using negative coping strategies increases PTSD, especially when the firefighter is experiencing higher levels of stress

Slide titled "Firefighter Stressors: Most Impactful by Service Area." It features a bar chart comparing stressor ratings (scale 1–5) across four service areas: Urban, Suburban, Rural, and Underdeveloped.

Slide titled "Firefighter Stressors: Most Impactful by Org Type" with a bar chart comparing stressor impact levels (scale 1–5) across three firefighter groups: Career, Volunteer, and Combination. Stressors include: - Overall Stress - Disruption of sleep (at work and home) - Job skill concerns - Conflicts with coworkers - Staffing issues - Critical incidents - Inadequate equipment - Family and childcare problems - Financial strain - Conflicts with management - Infectious disease concerns - Personal safety apprehensions - Lack of time off due to overtime - Second job responsibilities - Discrimination & harassment

Slide titled "Correlations" featuring a diagram that shows relationships between Self-Blame Coping and various outcomes, grouped into three categories: - Job Outcomes:   - Job Performance: negative correlation (-0.16)   - Work Withdrawal: positive correlation (0.20) - Well-being Outcomes:   - Social Withdrawal: (0.36)   - PTSD: (0.41) - Behaviors & Intentions:   - Suicide Ideation: (0.21)   - Intentions to quit:     - CFD (0.26)     - Fire Service (0.15) The diagram visually emphasizes that self-blame coping is associated with poorer job performance and increased mental health challenges.

INTERACTION EFFECTS ALSO SHOW using negative coping strategies increases PTSD, especially when the firefighter is experiencing higher levels of stress.

MENUCLOSE